Predict failure from condition measurements
Before you start: Repeated measurements of a degrading quantity on several items, and a threshold that counts as failure.
Some things don't fail without warning. Brake pads wear, bearings vibrate more, insulation resistance drops, crack lengths grow. If you're measuring that quantity, you have something much better than a failure history: you can see failure coming, on the specific item in front of you, before it happens.
Degradation modelling turns those readings into a prediction. Instead of "units of this type last about 4,000 hours on average", you get "this pad crosses the limit in about 600 hours."
What your data looks like
Long format: repeated measurements over time, for several items.
item,hours,wear_mm
pad-01,500,1.16
pad-01,1050,1.96
pad-02,500,1.15
Three columns matter:
- Item id — which item the reading belongs to.
- Time — when the measurement was taken.
- Measurement — the measured value.
You want several items, each measured several times. A single item's history tells you about that item; a population tells you about the spread, which is what lets you put uncertainty around a prediction.
Defining failure
The other half of the model is the failure threshold — the value of y at which the item is considered failed. An 8 mm wear limit, a minimum insulation resistance, a maximum vibration amplitude.
This is a judgement call, and it's yours to make. It's usually a standard, a manufacturer's limit, or the point past which secondary damage begins. It's worth being deliberate about, because everything downstream is expressed relative to it.
Go to Modelling → Degradation → New model, pick your dataset, choose the item id, time and measurement columns, and set the Failure threshold along with the Time unit and Measurement unit so the outputs are labelled properly.
In the next step you choose a path — how degradation progresses. The default, Best (auto-select by AICc), tries all nine paths and keeps the one that fits best. Linear is the common case for steady wear; choose another when the physics says wear accelerates or plateaus. What the model does is fit a path to each item, extrapolate each to the threshold, and then fit a life distribution to the resulting crossing times — which is how a set of wear curves becomes a reliability model of the population.
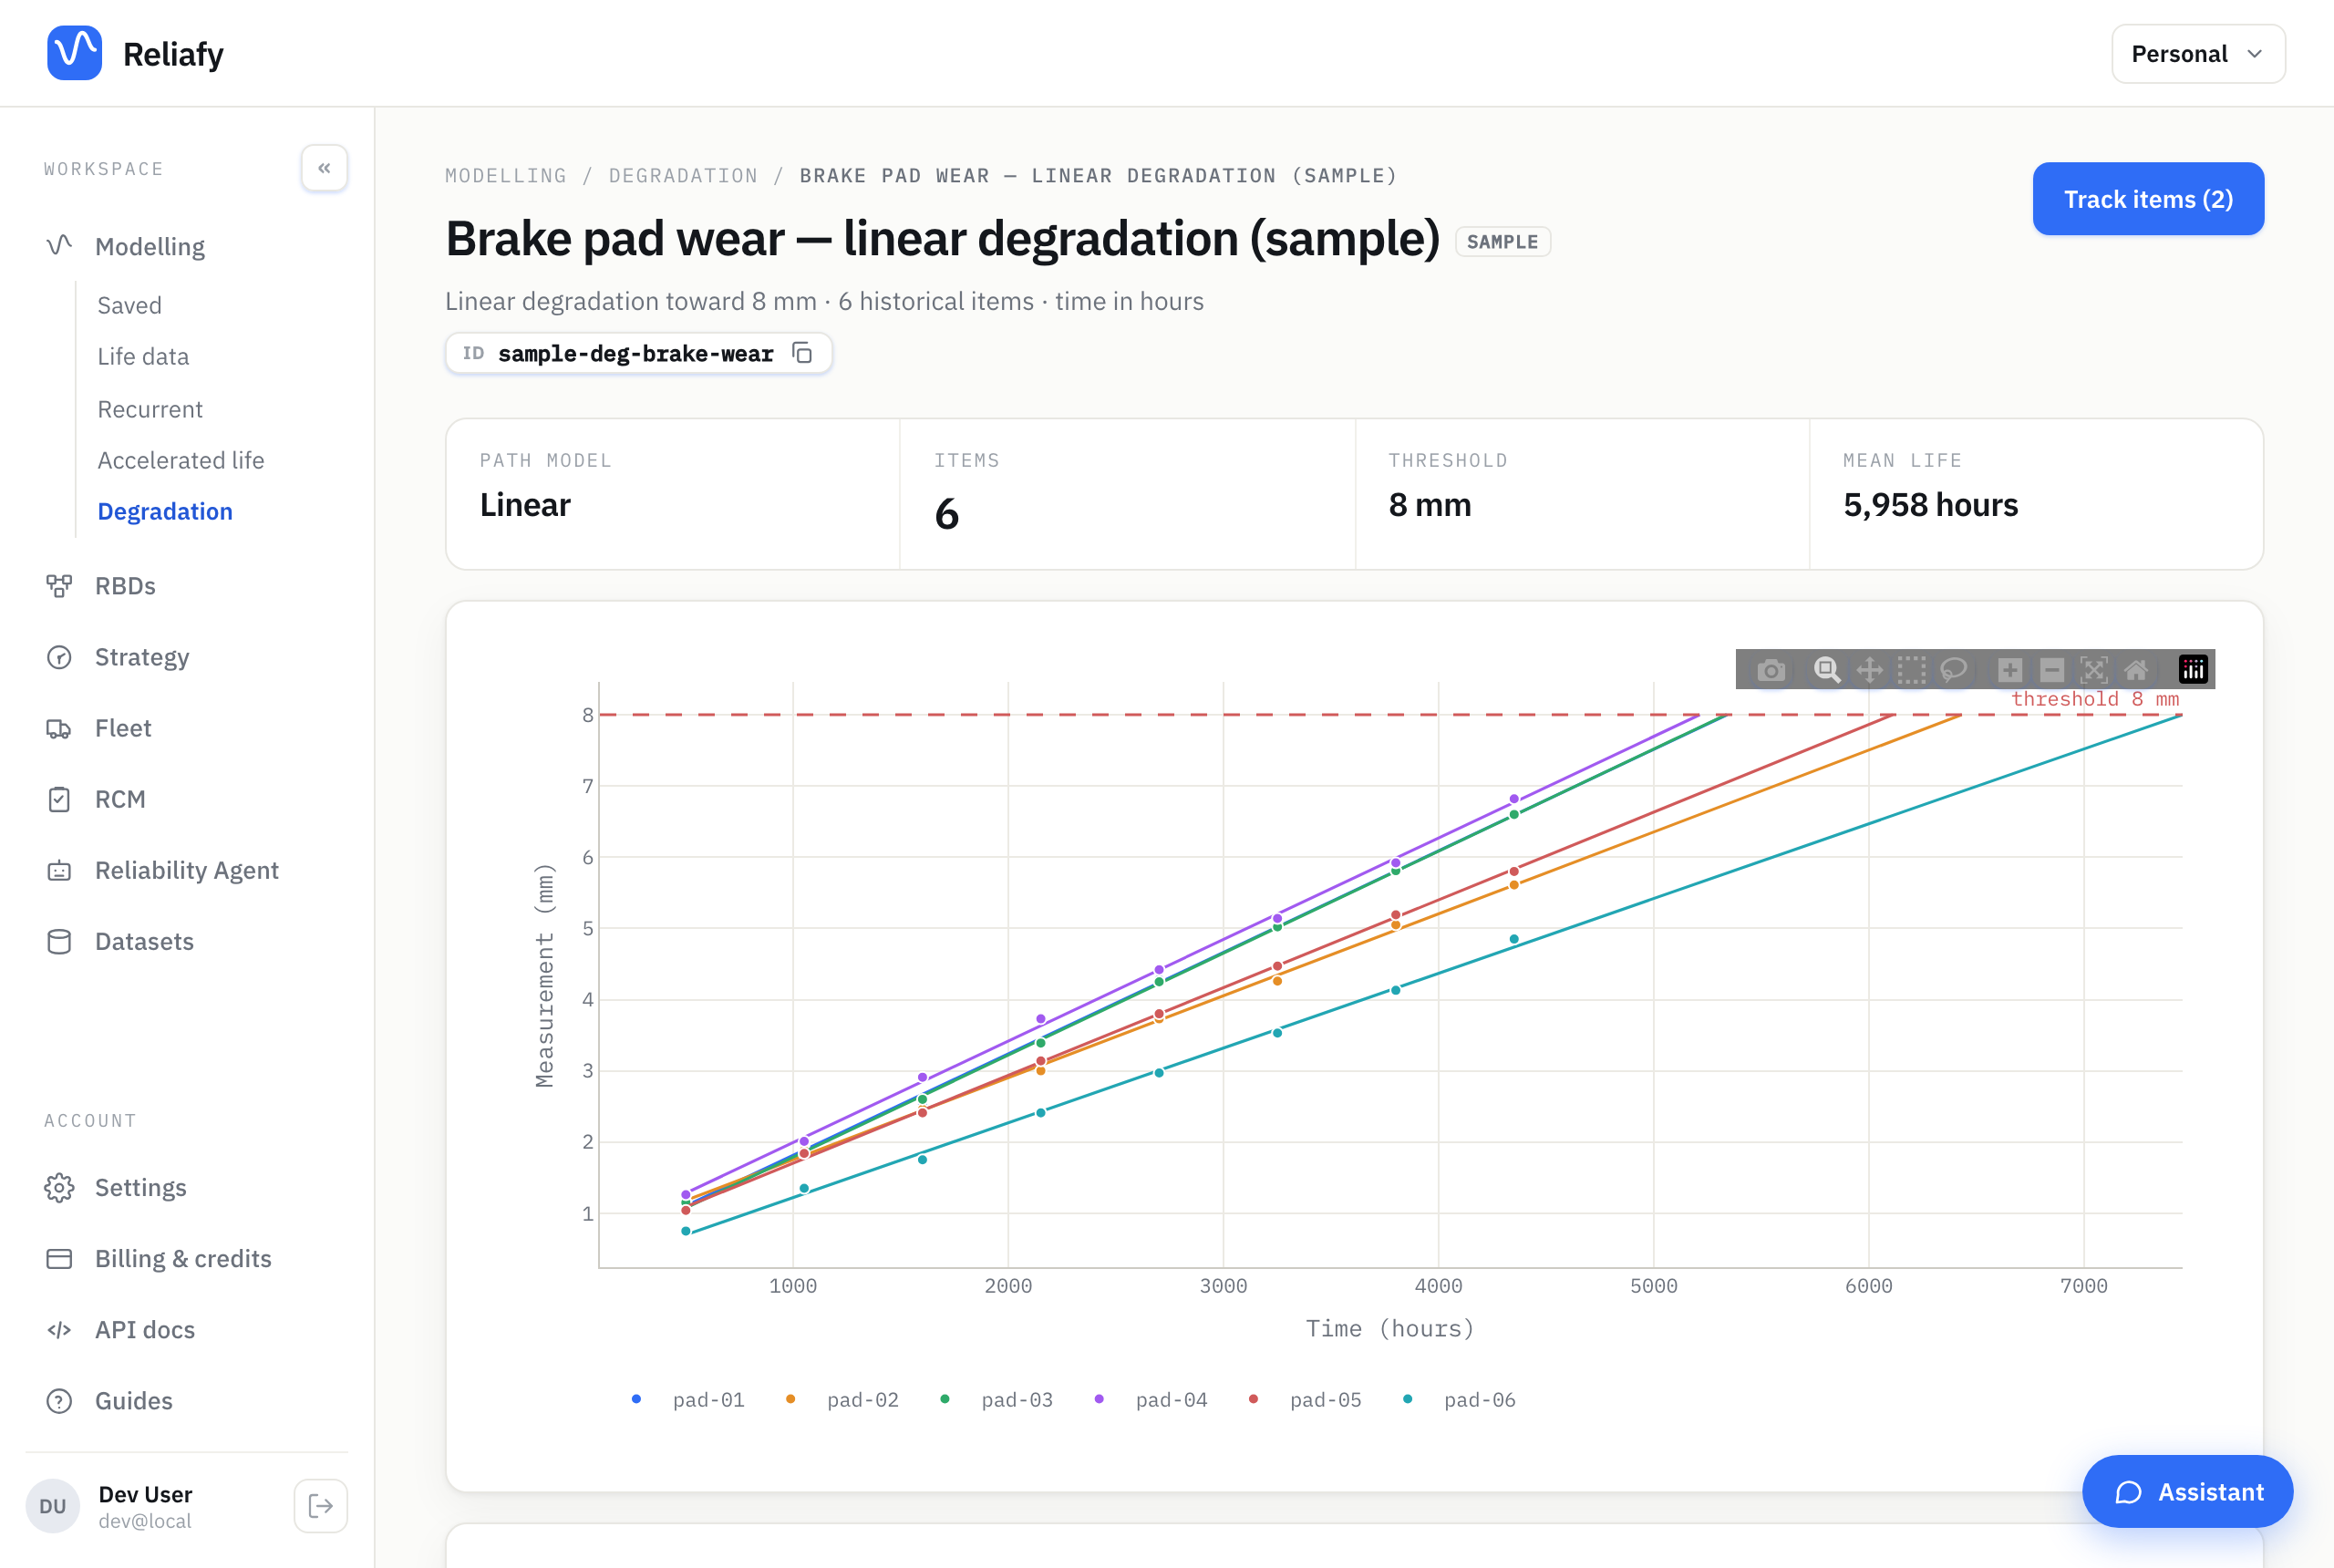
For the sample brake pads (six pads, an 8 mm wear limit, linear paths) the crossing times fit a Weibull with a mean life of 5,960 hours, and a design life of 3,210 hours: 90% of pads survive that long, at 90% confidence.
From population to individual
The population model is useful, but the real payoff is per-asset.
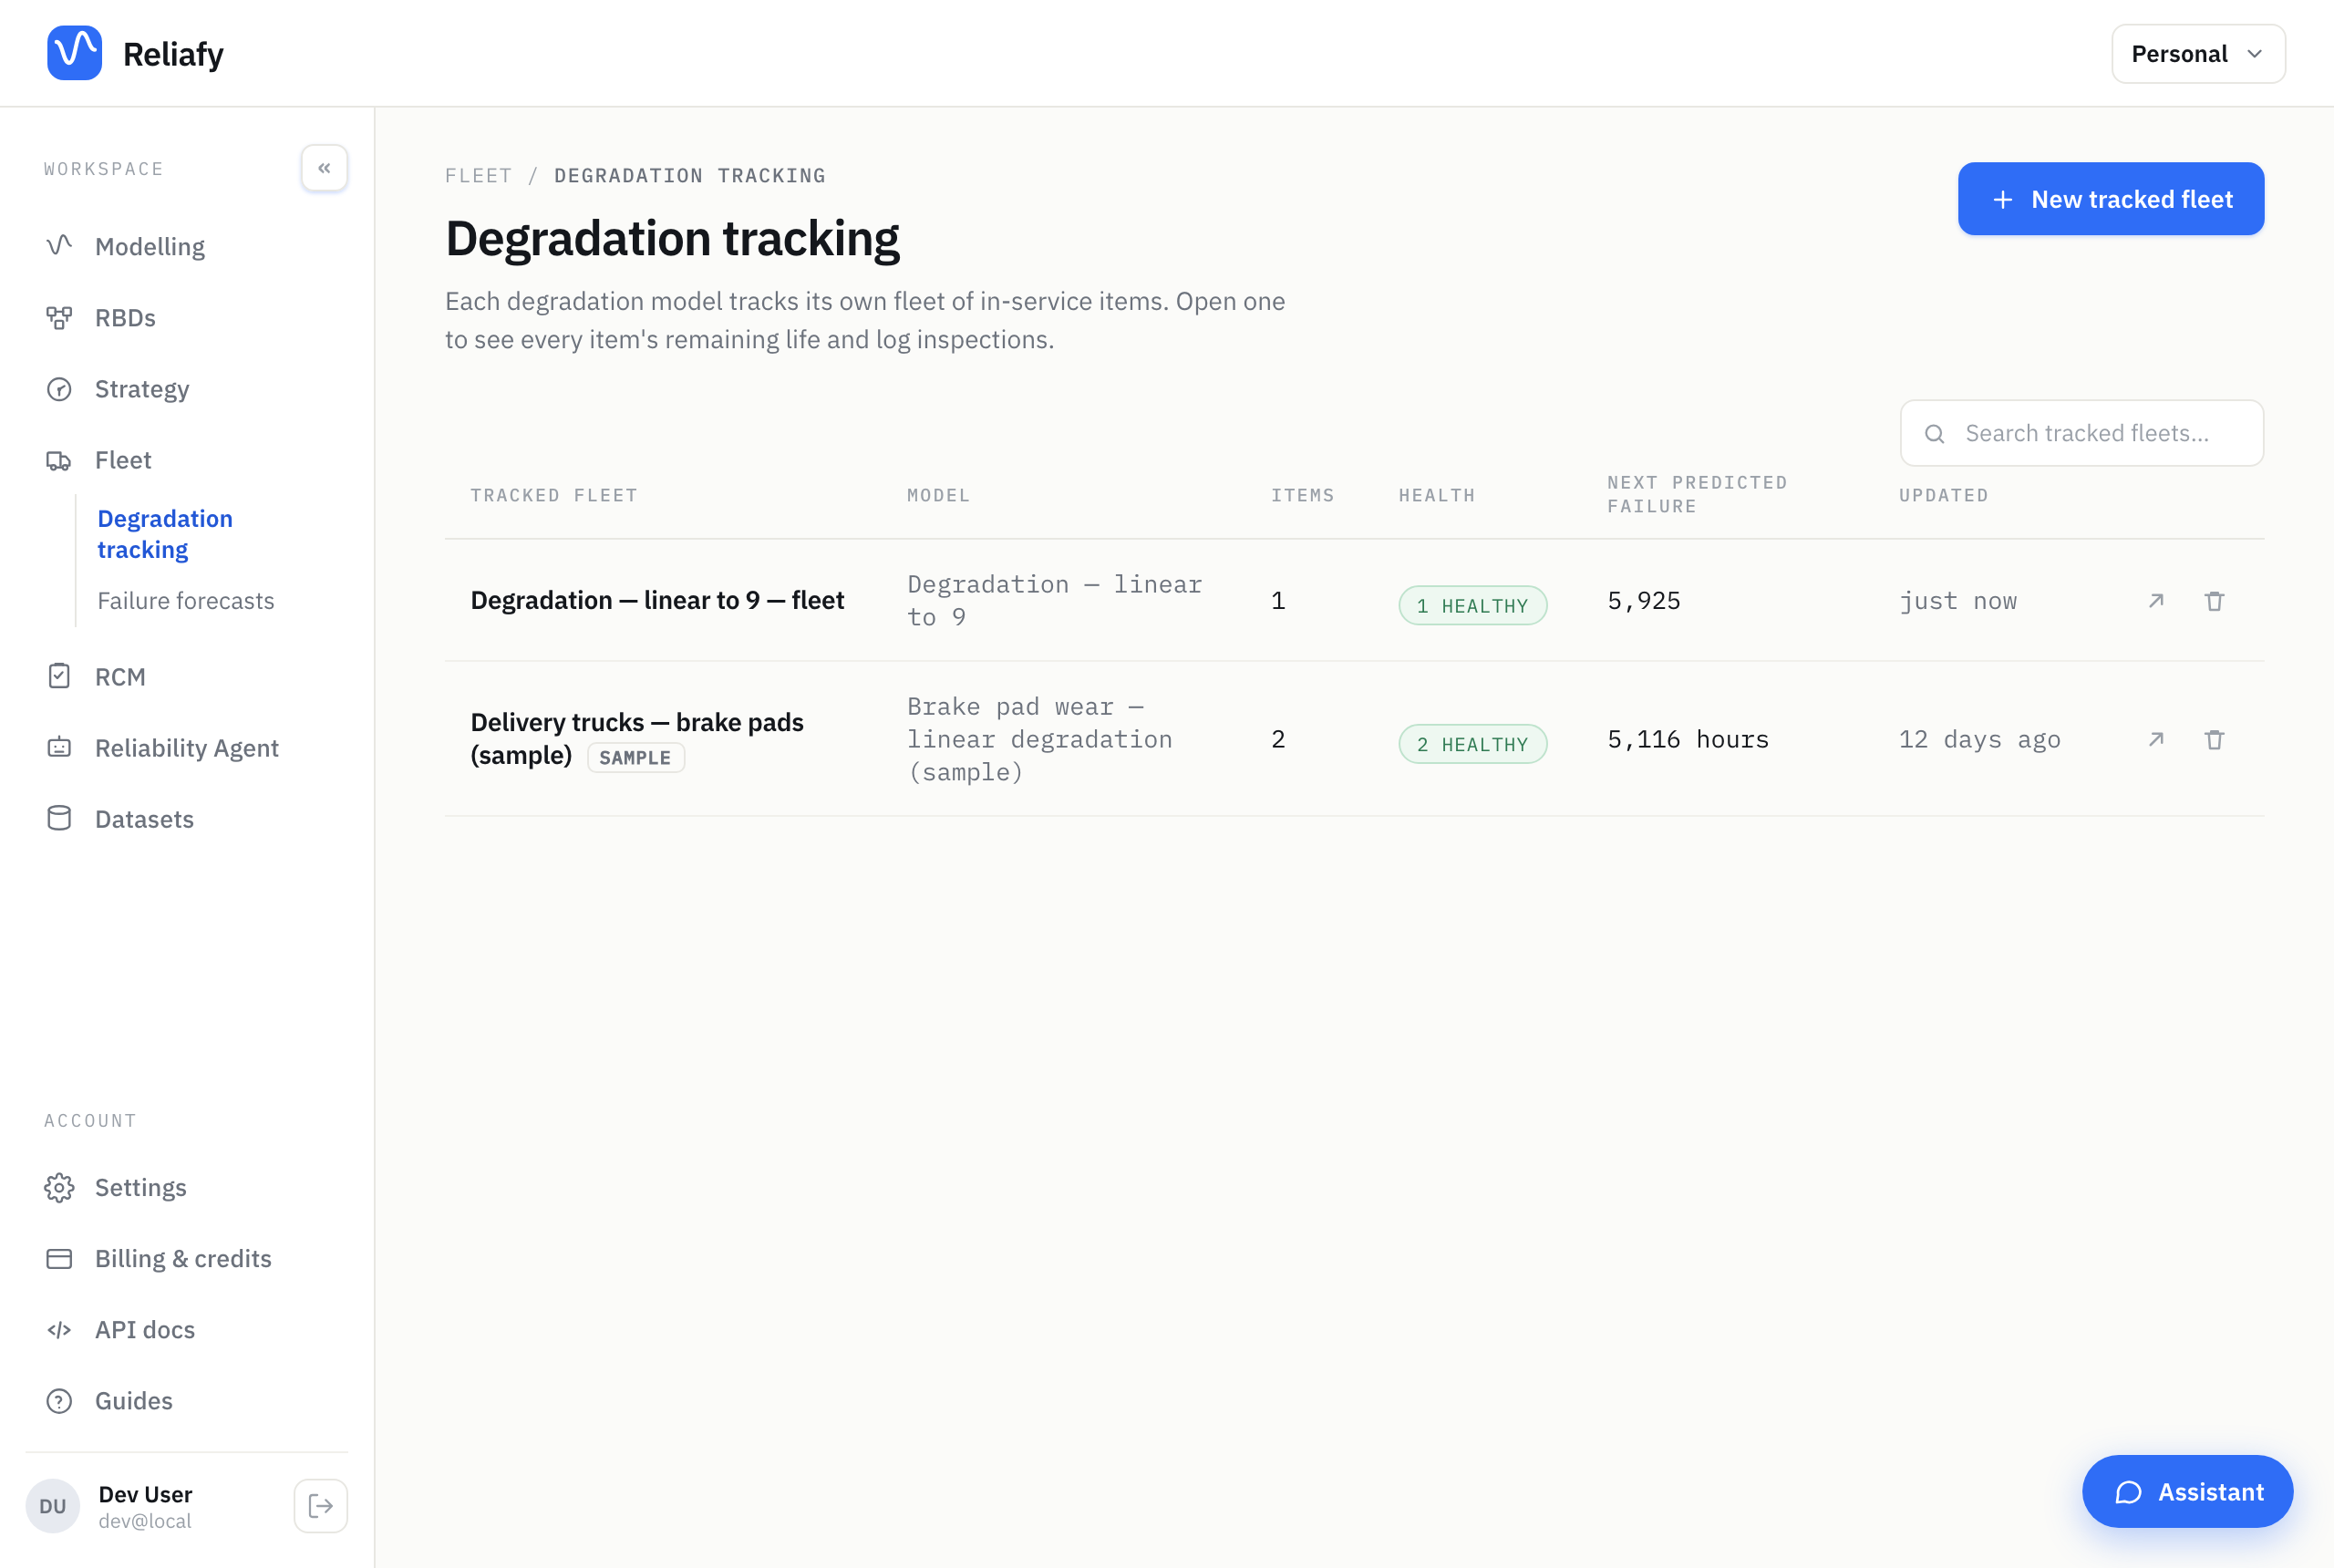
Under Fleet → Degradation tracking (or Track items on the model's page), register the individual assets you care about — Truck 07's front-left pad, specifically — and record measurements against them as you take them. Each new reading updates that asset's own projection: its current trajectory, when it's forecast to cross the threshold, and how much confidence to place in that.
That's the loop that makes condition monitoring worth the effort. A reading taken on Tuesday can change a replacement date by Wednesday, for one named asset, rather than feeding a fleet-wide average that nobody acts on.
A caution about extrapolation
Predicting a crossing time means extrapolating beyond your last measurement, and the further out it is, the less you should trust it. An item at 30% of its threshold has a wide, soft prediction; one at 85% with a consistent trend has a sharp one.
Treat early predictions as ordering information — which assets are ahead of the pack — rather than dates to put in a plan. As readings accumulate the predictions tighten, and that's when they're worth scheduling against.
Where to go next
The modelling approaches and worked examples are covered in the blog post on degradation analysis.
If you'd rather predict from failure history than from condition readings, fit a life model instead — the two are complementary, and plenty of equipment justifies both.