Model system availability (repairable RBD)
Before you start: A system you can sketch as blocks, and a failure and repair estimate for each block.
Most reliability block diagrams answer the question "will this survive to time t?". That's the right question for something you run to failure and replace. But if your system gets fixed and put back into service — a pumping station, a production line, a data-centre power train — the question you actually care about is different: what fraction of the time is it up?
That's availability, and Reliafy models it as a distinct kind of diagram. This guide walks through building one.
Choose the system type first
An RBD in Reliafy is either non-repairable (analysed for reliability over time) or repairable (analysed for availability). It's a single choice for the whole diagram, because it changes what each block needs and what the results mean — you can't mix the two in one diagram.
Open RBDs → New diagram, and set the menu beside Unit in the toolbar to Repairable. (Non-repairable diagrams give you reliability over time; repairable ones give you availability — hover the menu for the reminder.)
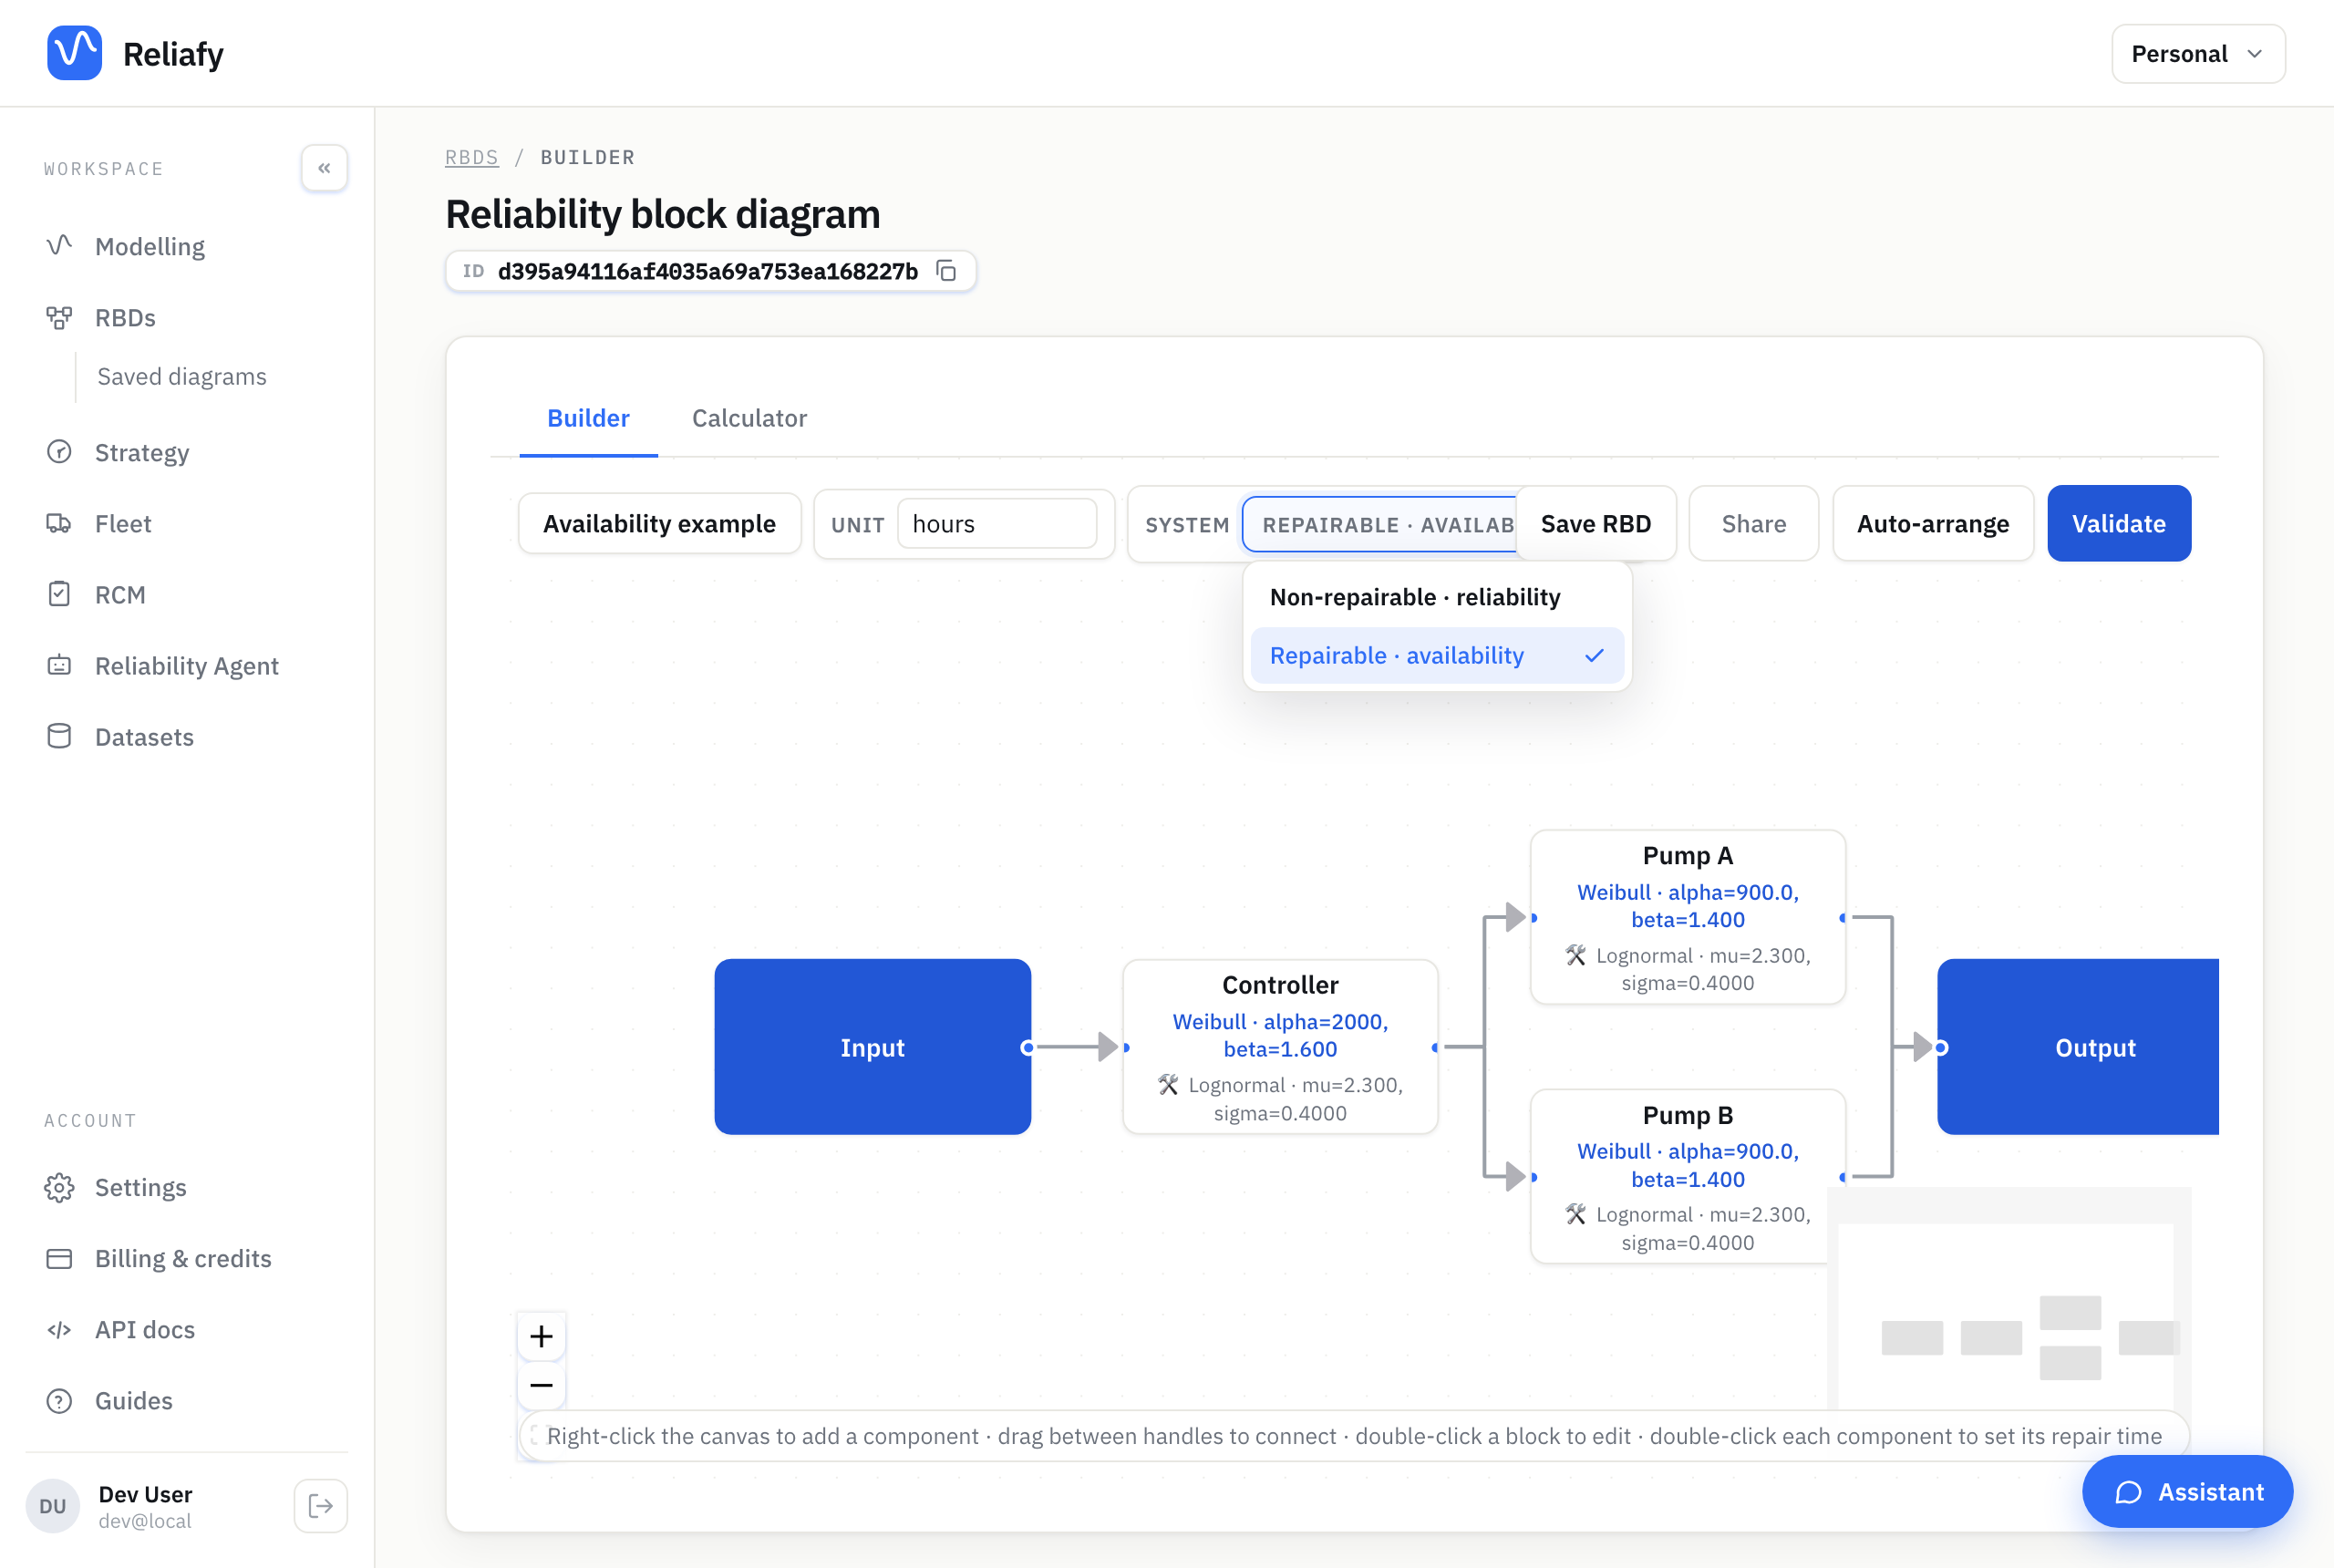
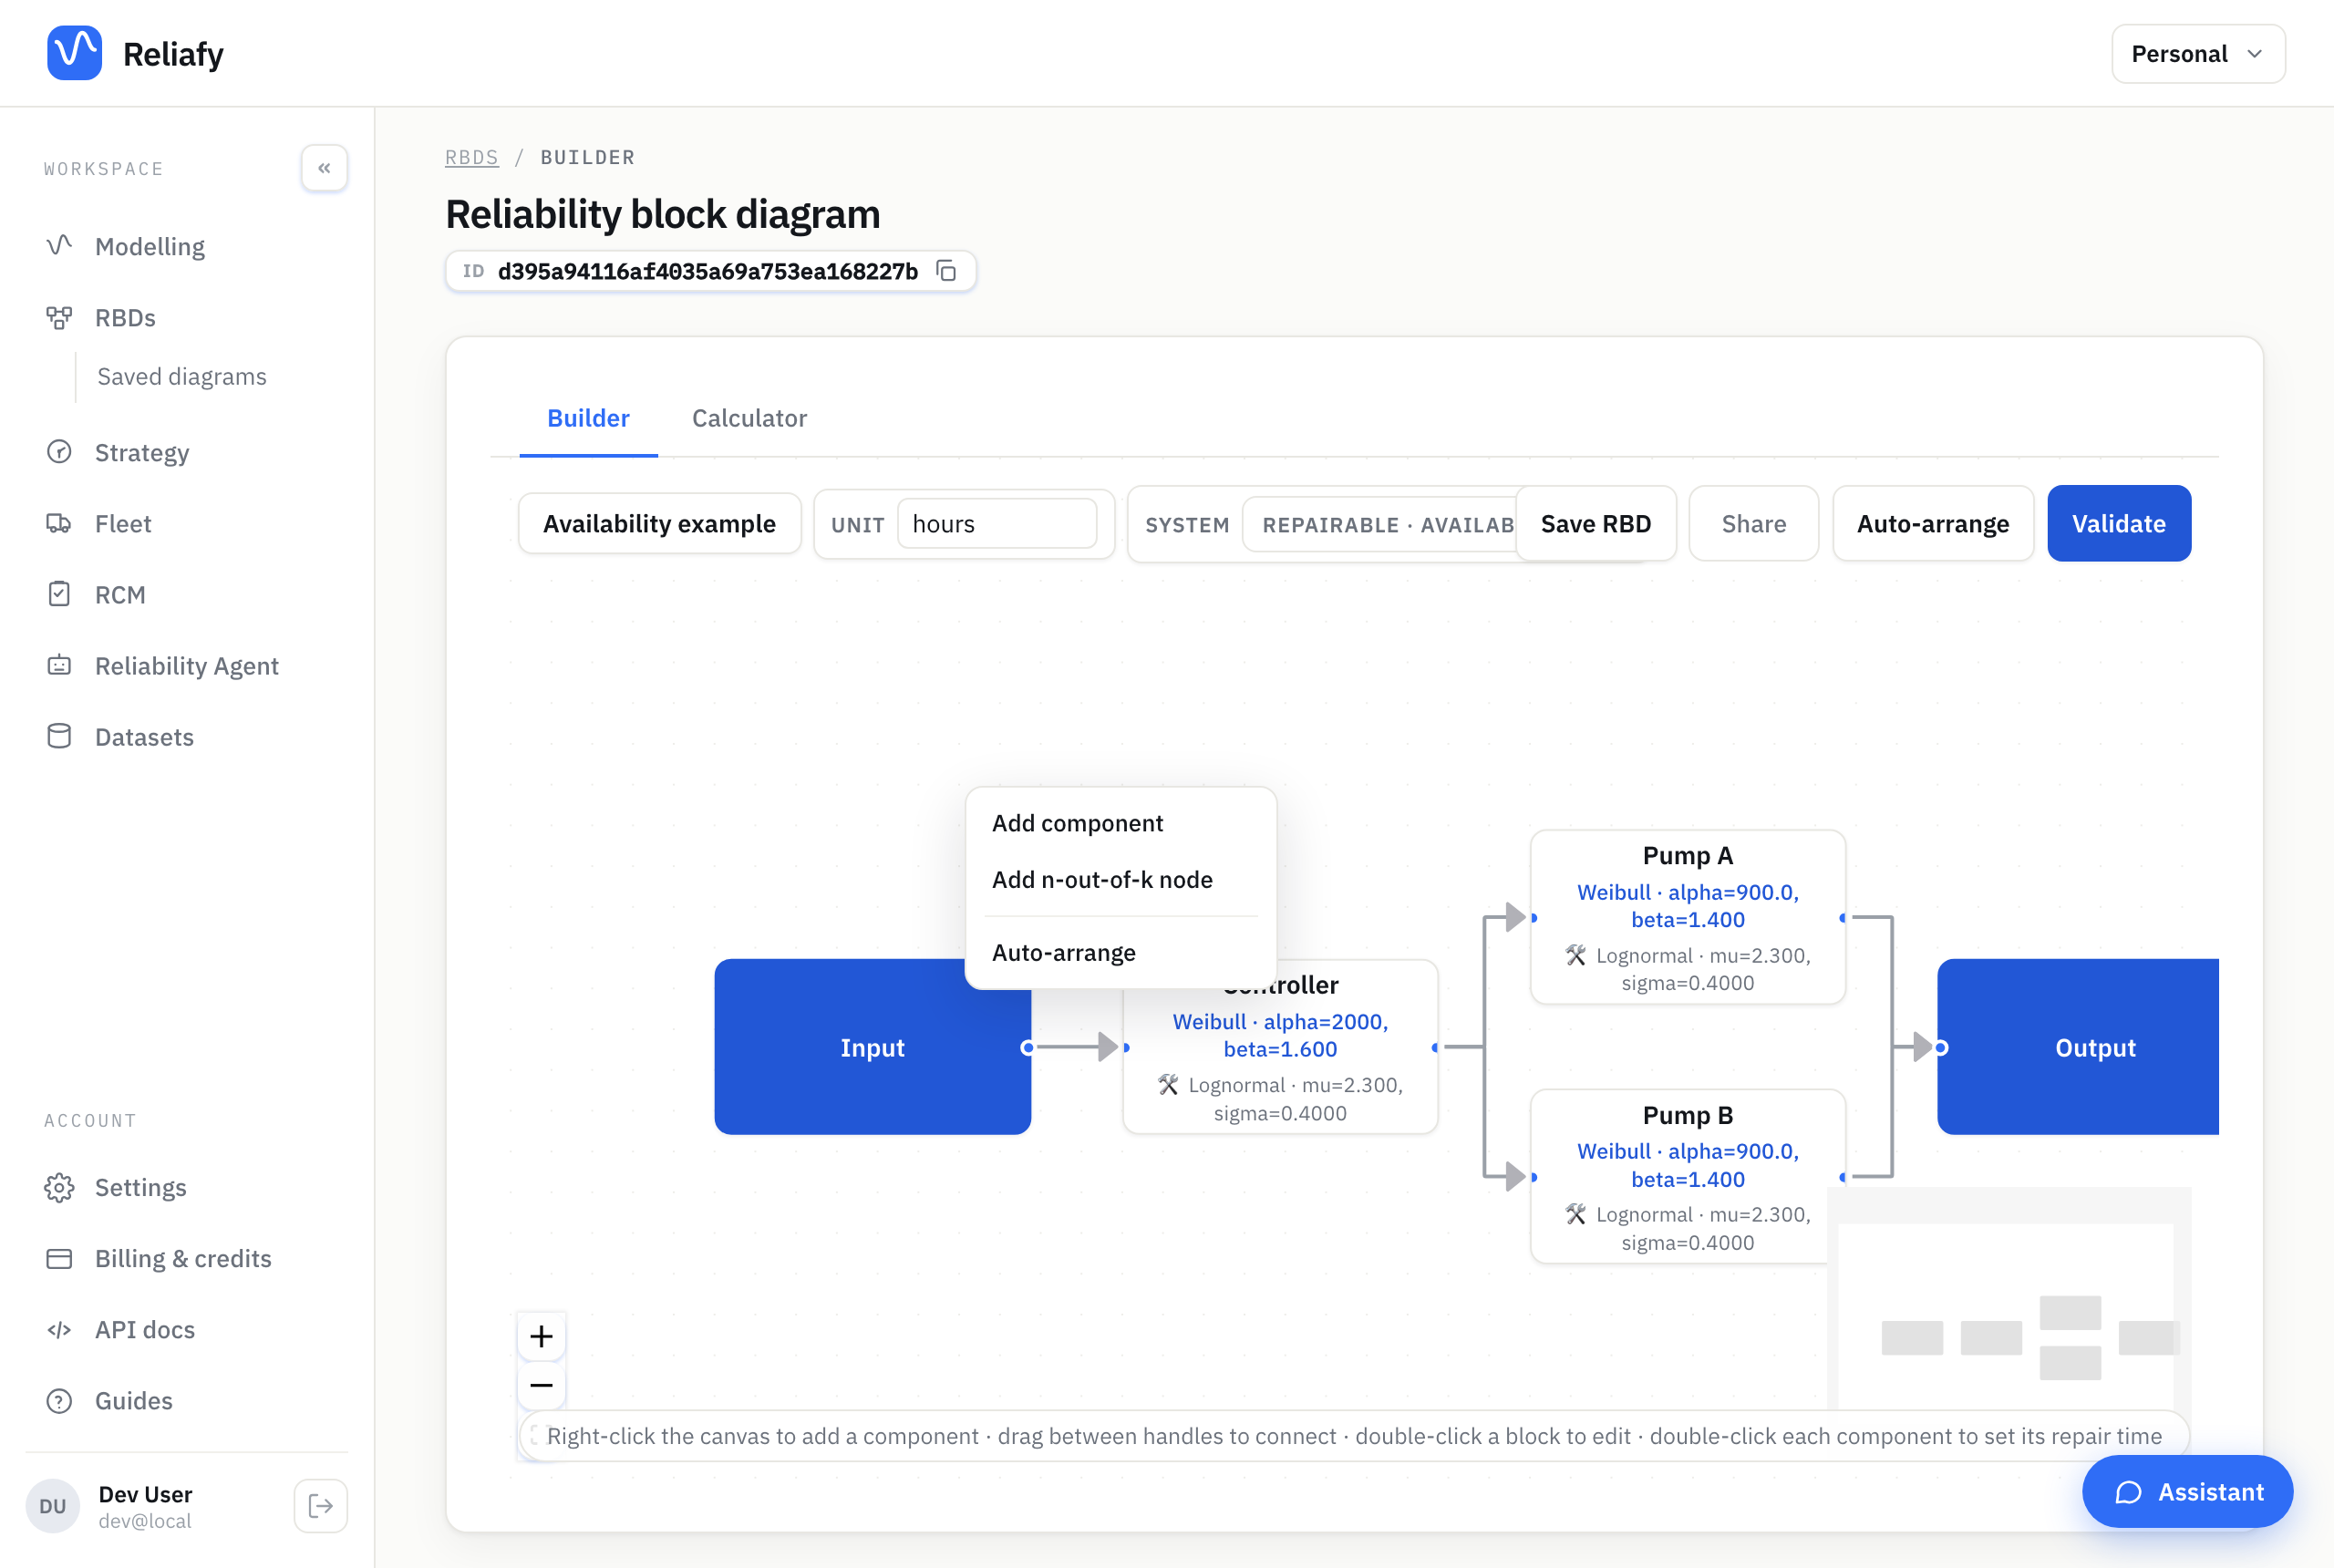
The moment you do, the diagram is in availability mode, and + Add block (or a right-click on the canvas) offers the blocks a repairable diagram can solve: components, junctions, voting nodes (MooN) and standby groups, whose duty unit and spares are each repaired when they fail. Load-sharing, n-identical series or parallel blocks and sub-systems aren't offered, so you can't build something Reliafy can't solve.
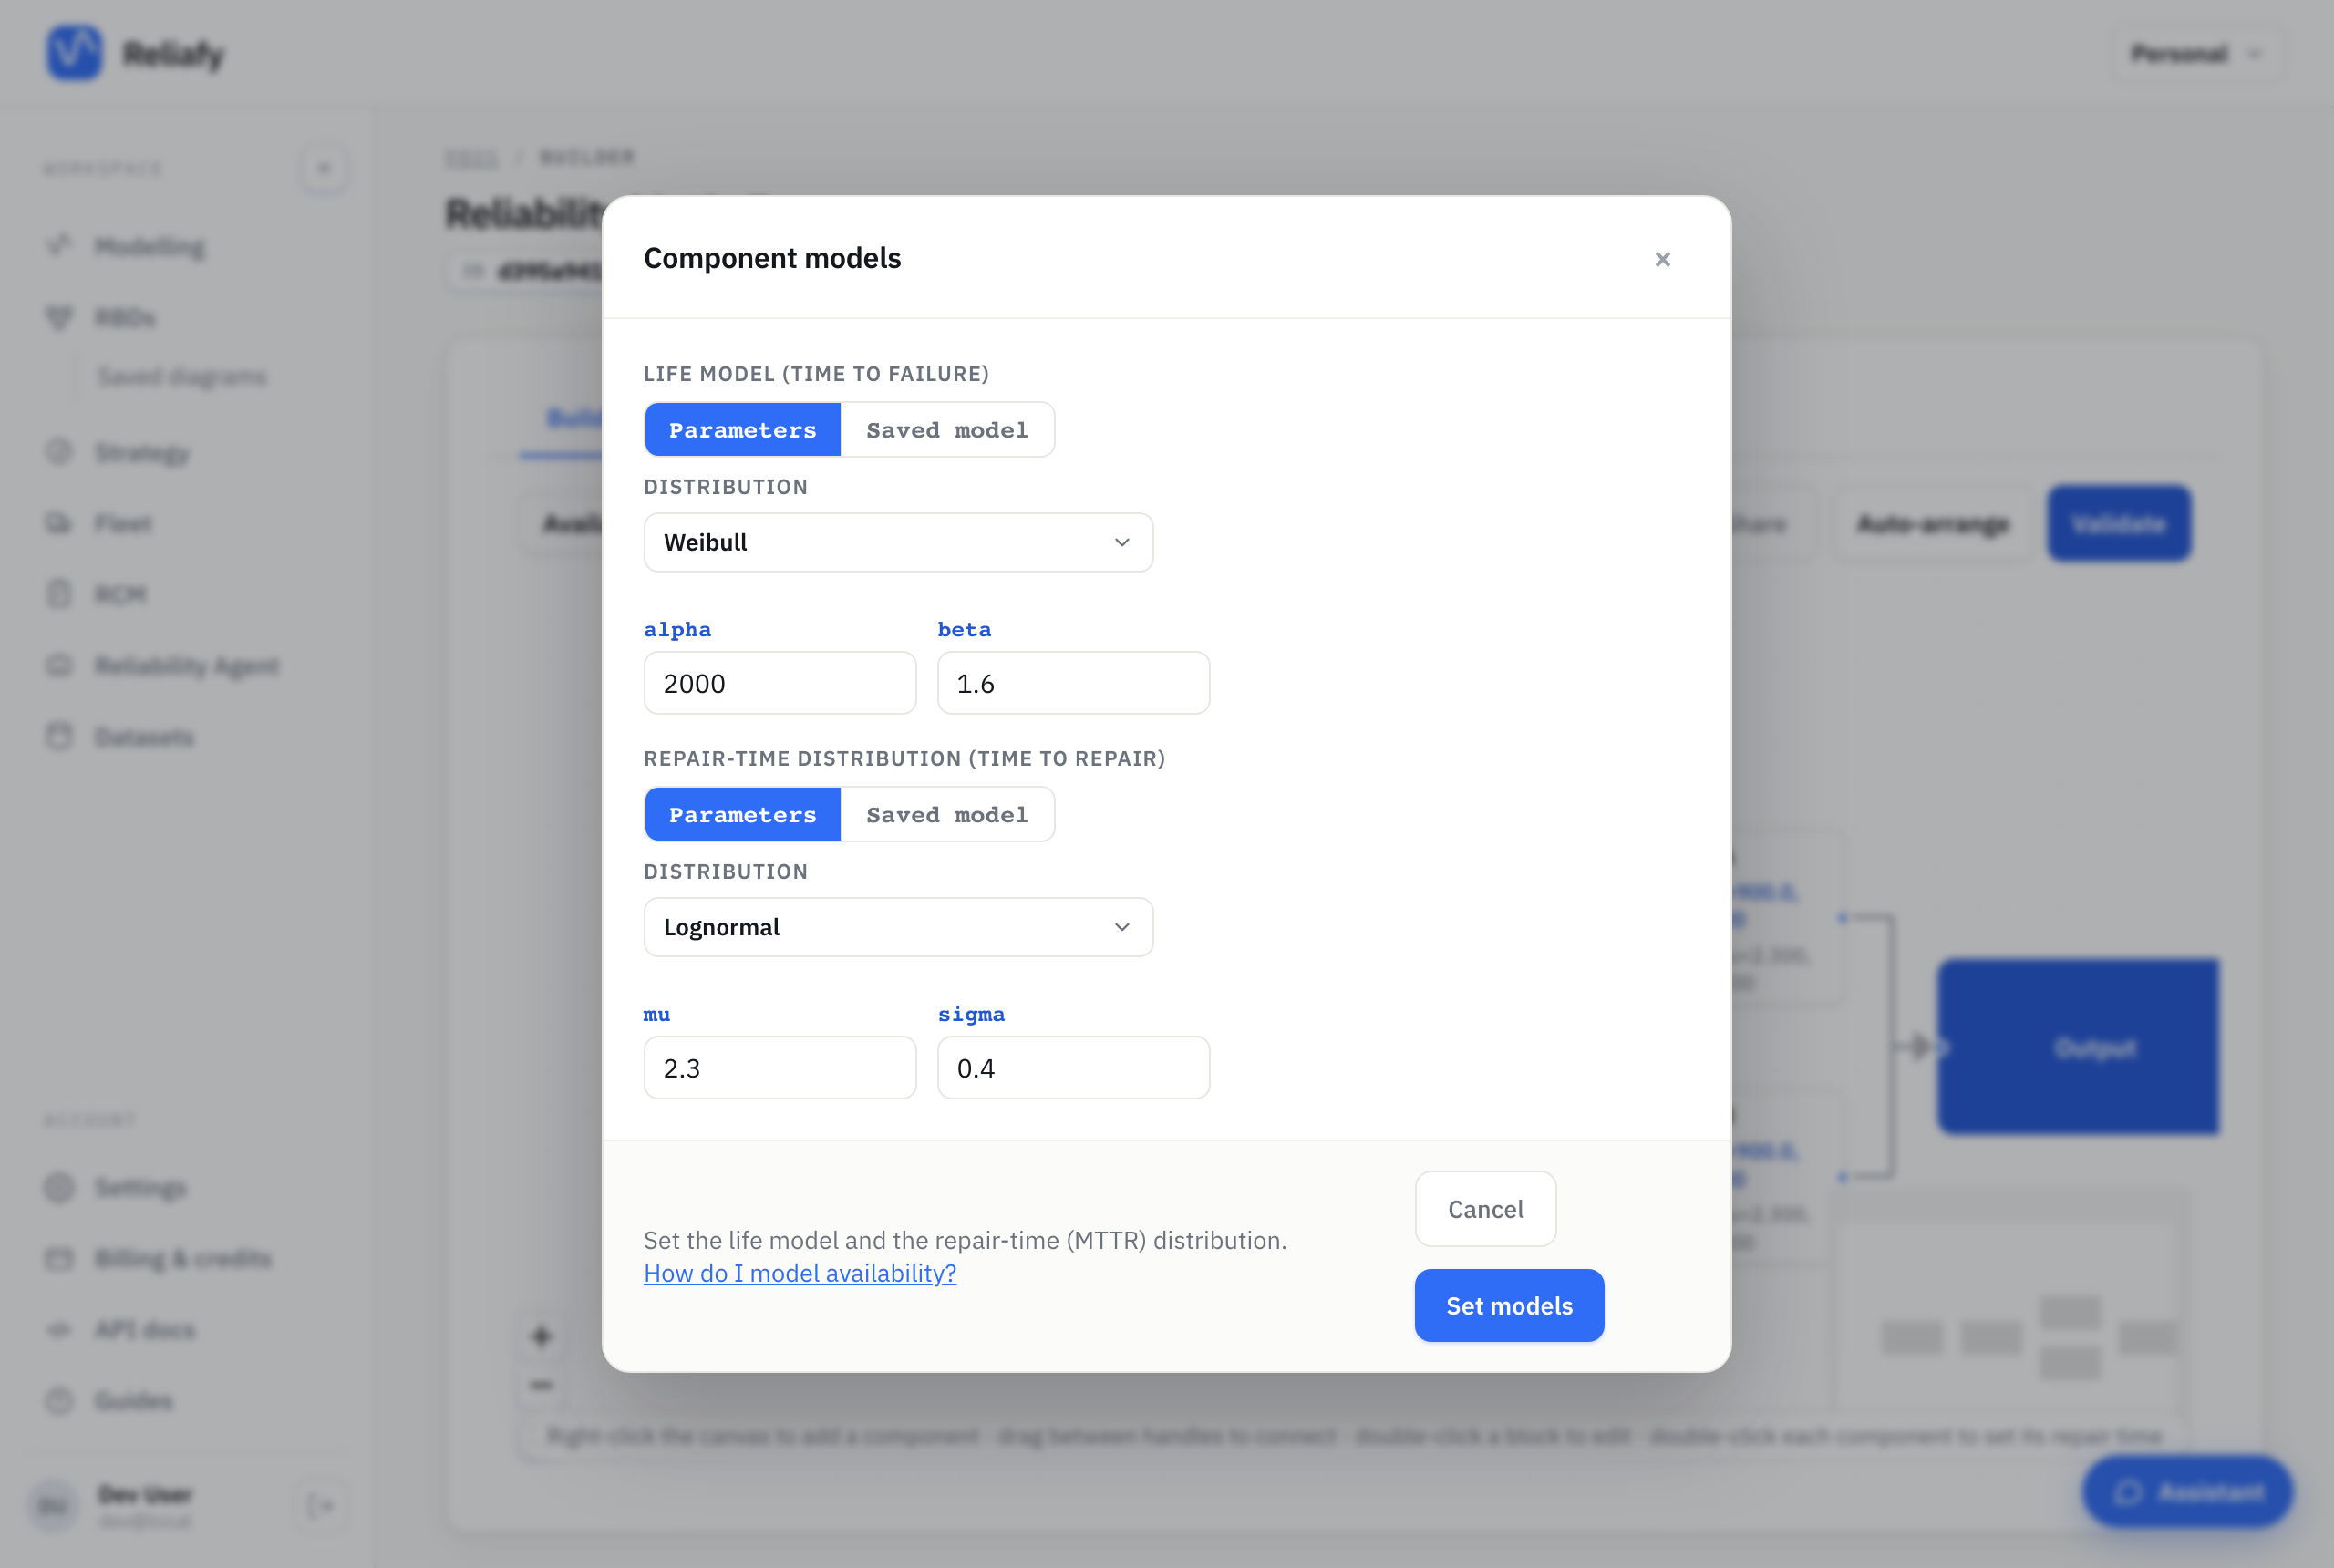
Every component needs two distributions
This is the part that's genuinely different from a normal RBD. A repairable component is characterised by two things:
- A life model — how long it runs before it fails.
- A repair-time distribution — how long it takes to get back into service.
Availability depends on the ratio of those two, so the repair side matters just as much as the failure side. A pump that fails monthly but is swapped in twenty minutes can be more available than one that fails yearly but takes a week to source parts for. A diagram with only life models can't tell you that, which is why Reliafy insists on both.
Double-click a component to set them, each as a Mean, Parameters or a Saved model. Repair times are usually right-skewed — most repairs are quick, a few drag on — so a lognormal is the conventional choice for mean-time-to-repair. The block's summary shows the result: MTTR 10.8 h for a lognormal with μ = 2.3 and σ = 0.4.
When the repair time doesn't matter (or you have no data for it), tick Repaired instantly: the block still fails, and still costs, but is never down. Every block repaired instantly in the toolbar's ⋯ menu does the same for the whole diagram.
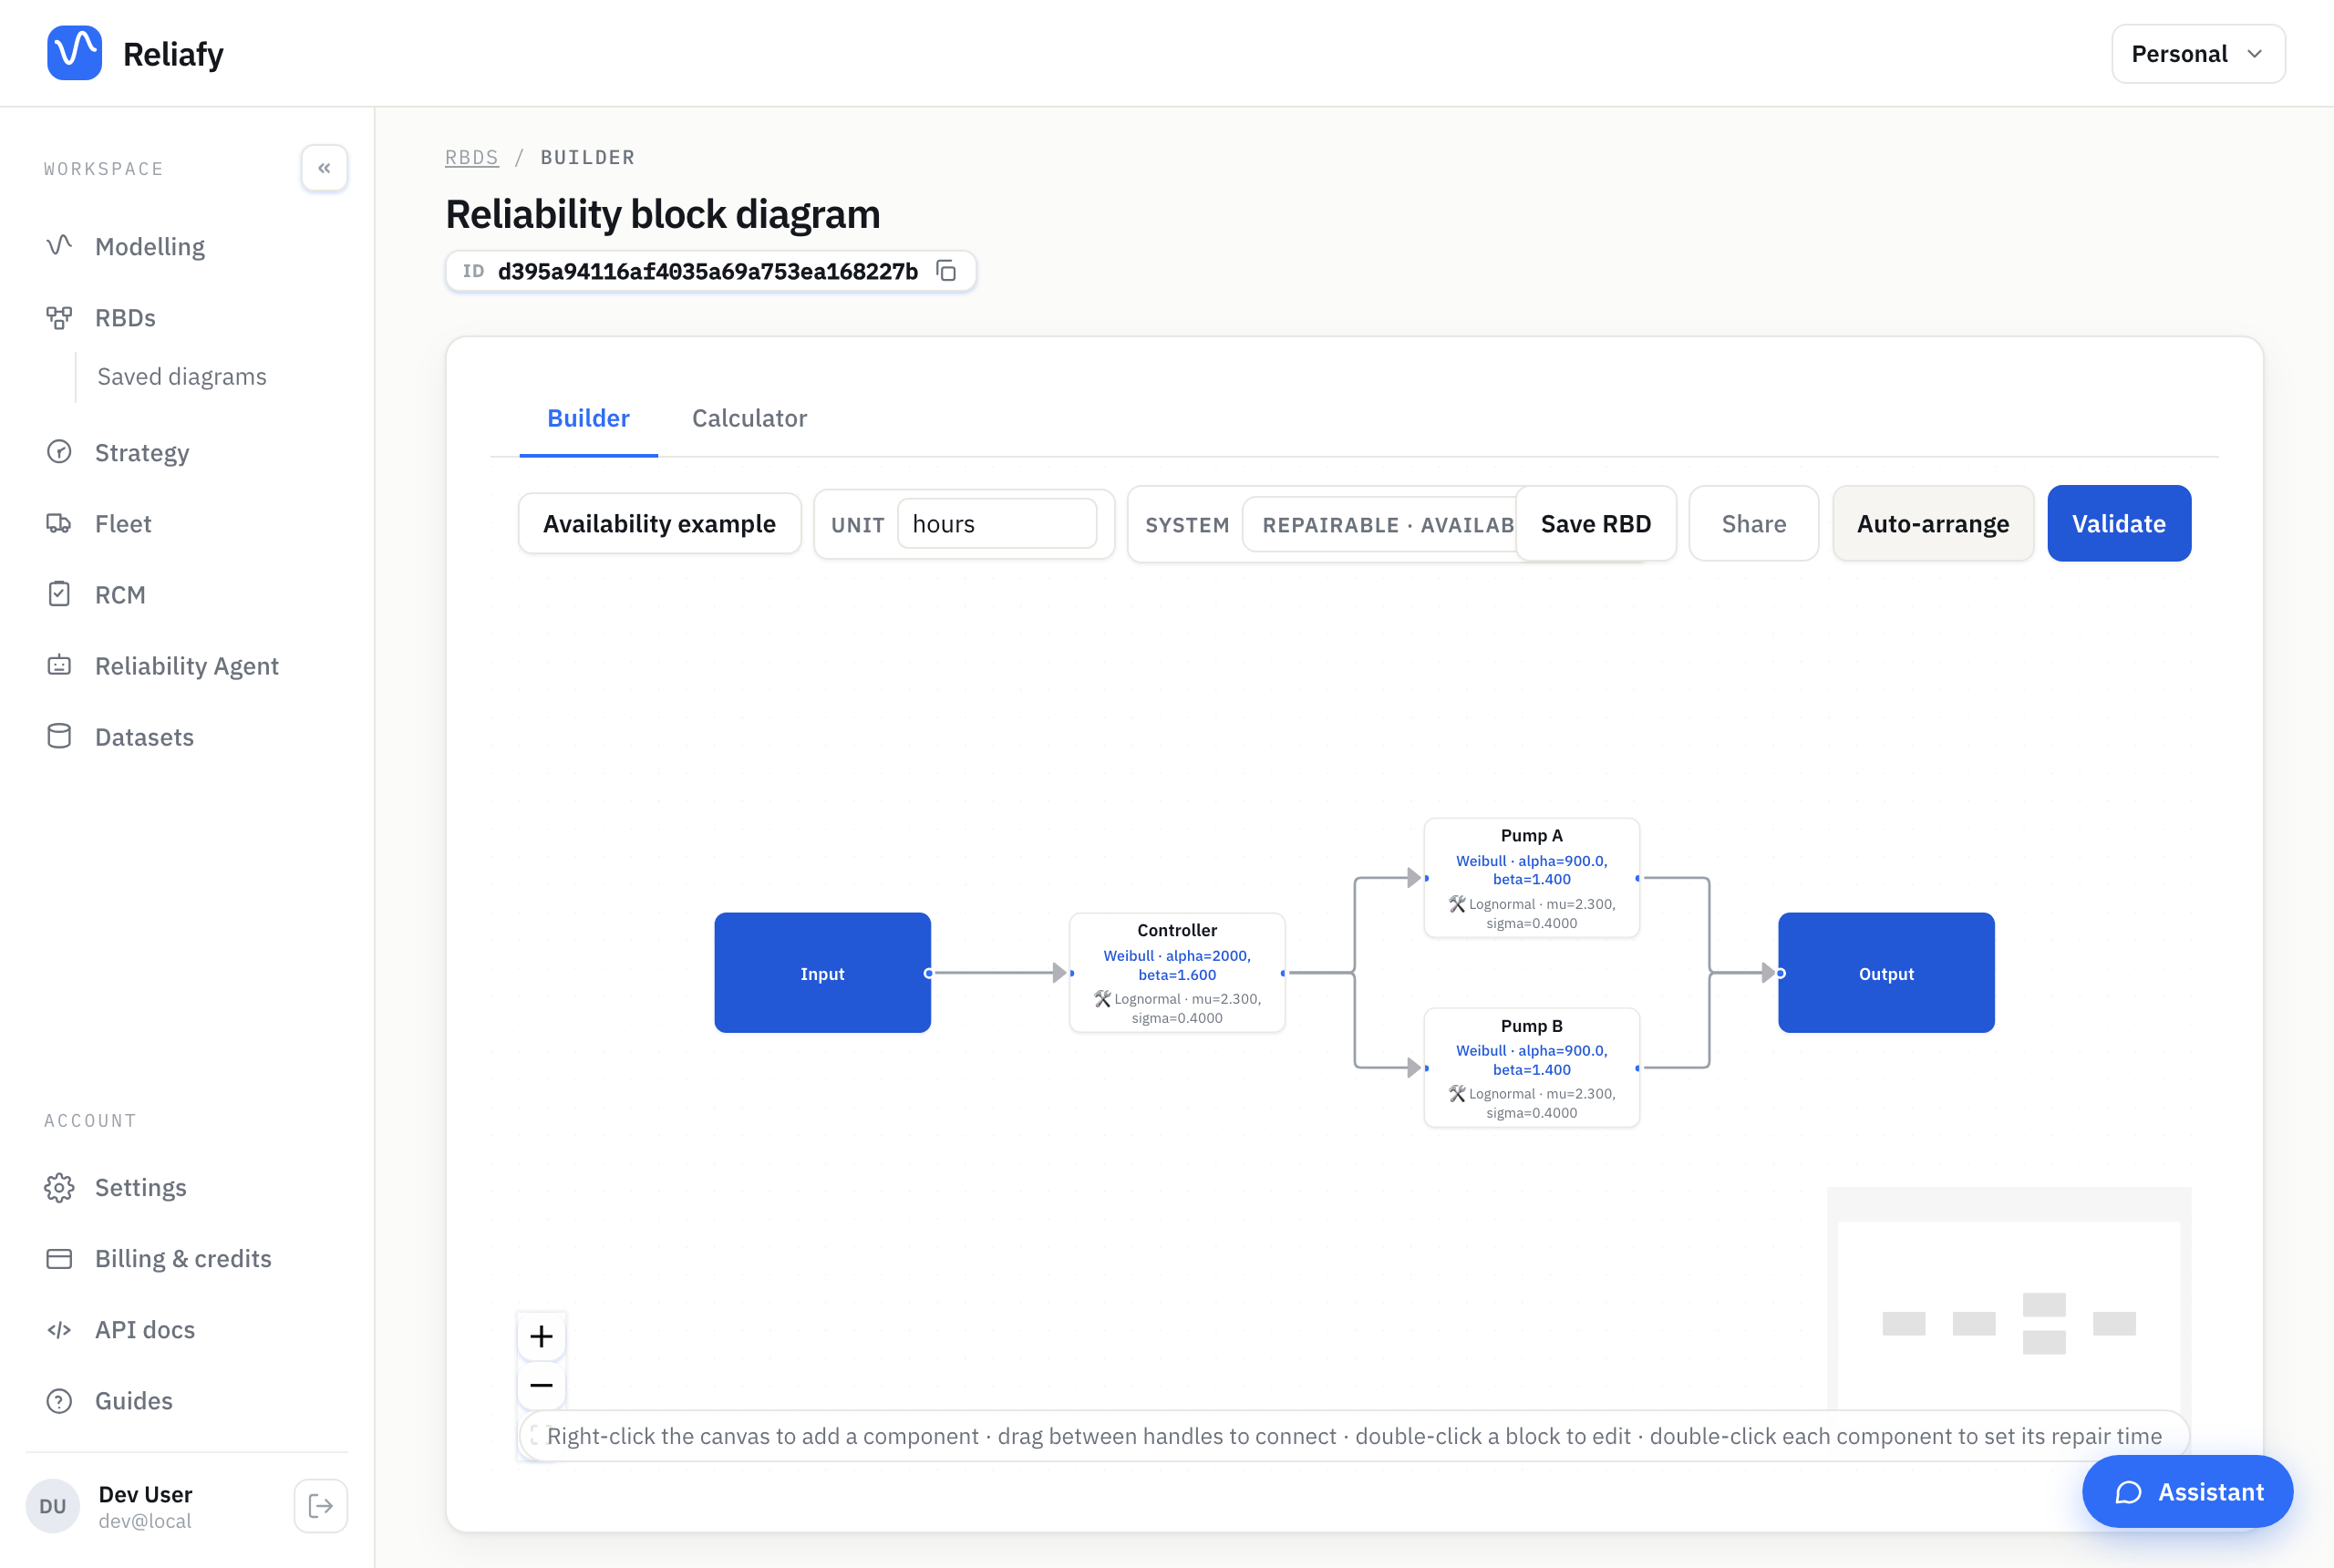
Wire the diagram up as you normally would: drag from the input handle through your components to the output, with redundant units in parallel. Or select a block and use + Add block → Add alongside (in parallel) to add its redundant partner already wired in.
Validate, then calculate
Hit Validate at the right of the toolbar. In availability mode this checks the thing that actually blocks the calculation — that every component has both a life model and a repair time — and it will name any block that's missing one. Once it passes, the button reads ✓ Valid; click it to see how the figures will be found. For this diagram the long-run figures are exact and nothing needs simulating.
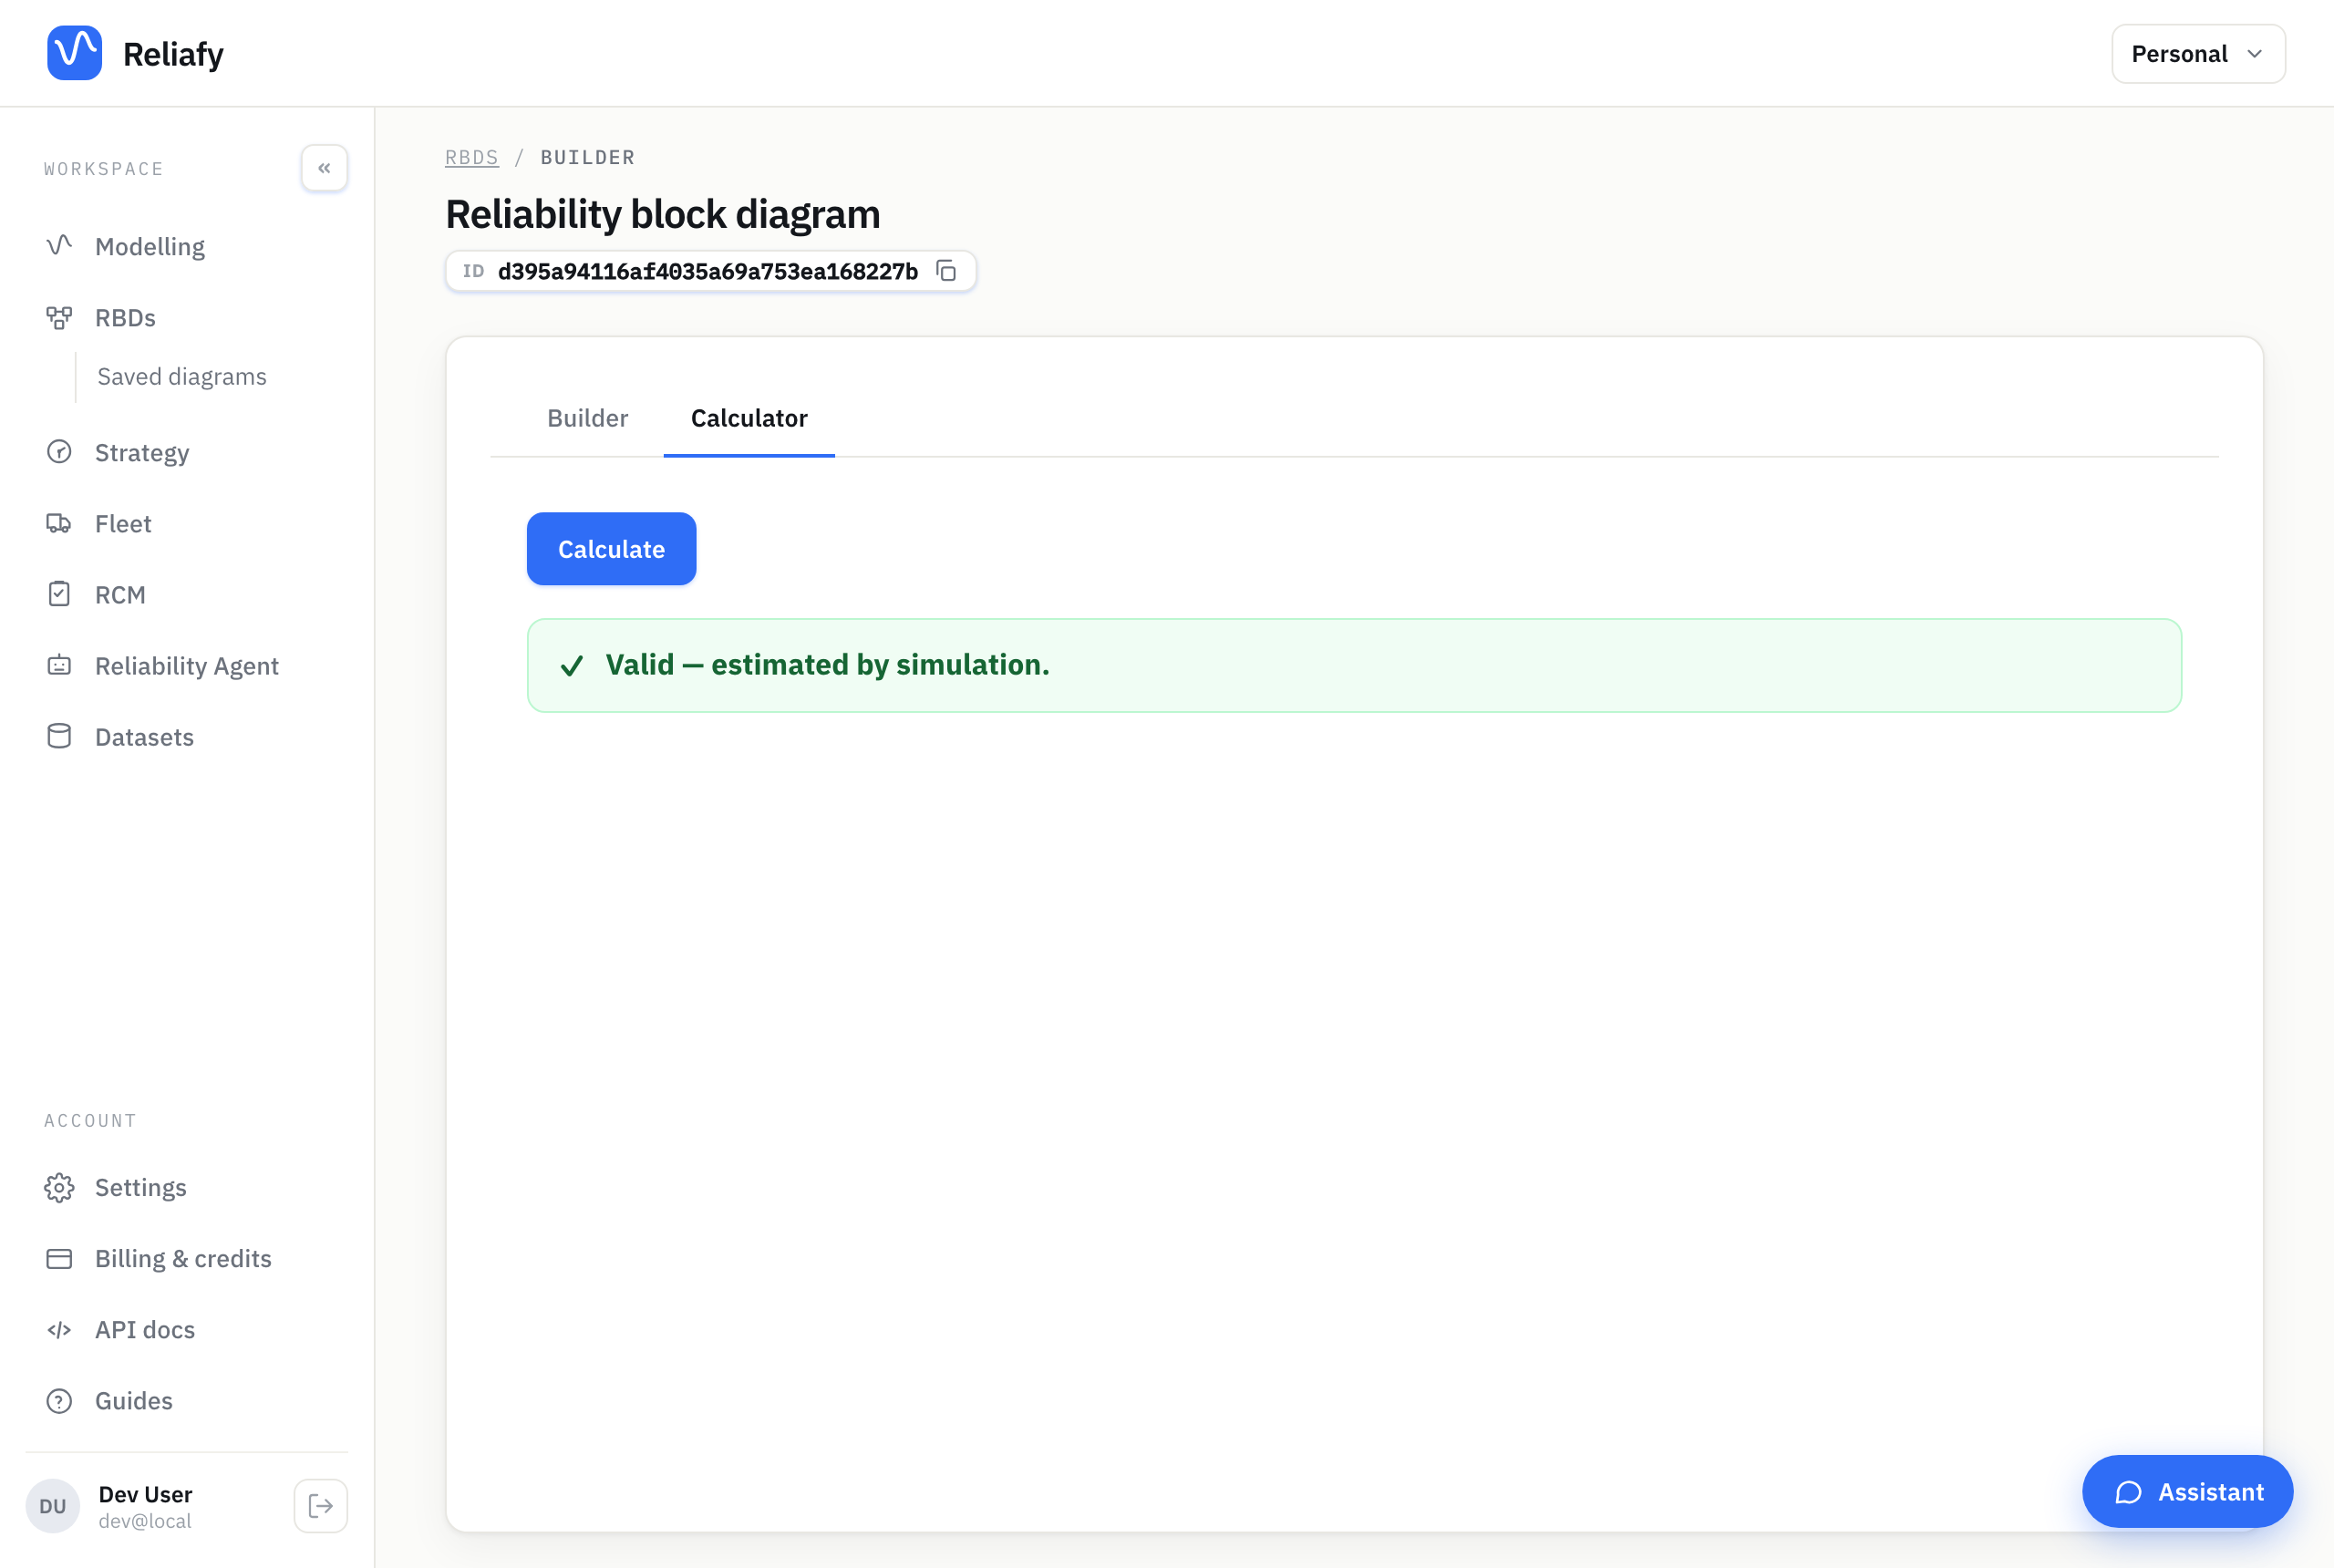
Then switch to Calculator, choose the Window (a month, a year, five years or the long run) and press Calculate.
Reading the results
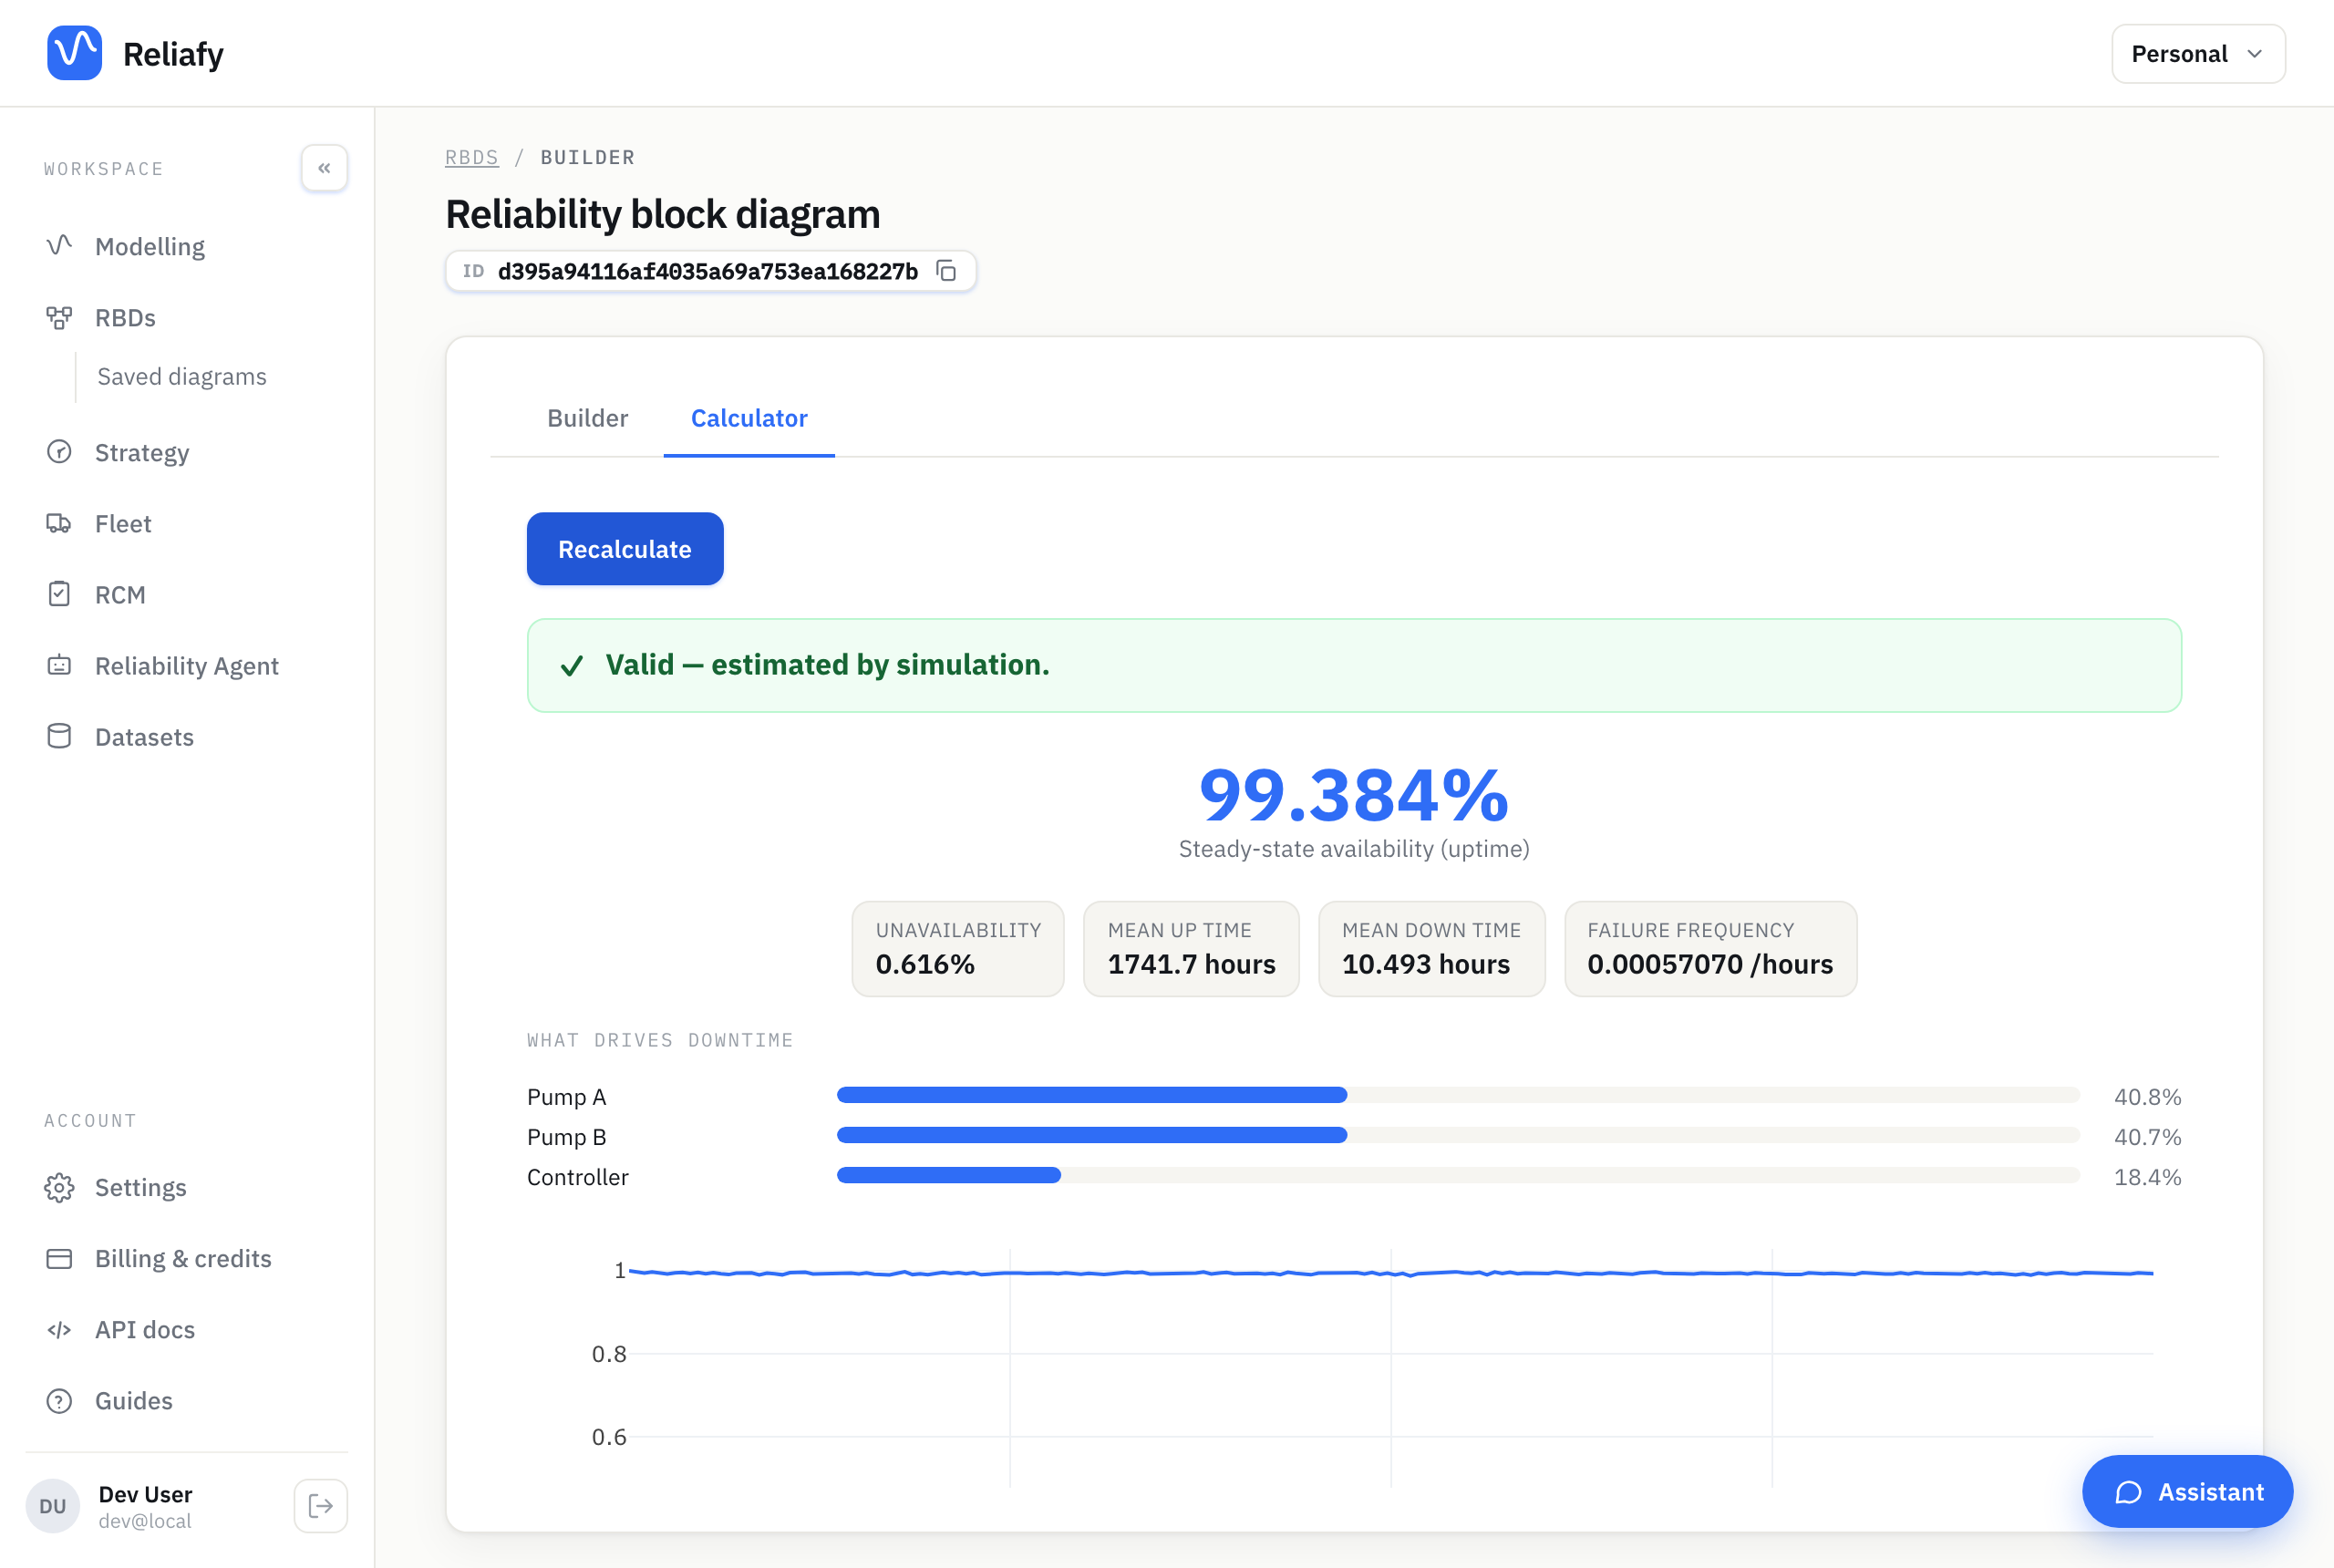
The headline is the long-run availability — the fraction of time the system is up — with the downtime it means in hours a year. For the example, a controller in series with two redundant pumps, that's 99.384%, about 54 hours down a year. The chart under it is availability over time, A(t), settling from 100% when everything is new to its long-run value.
The next two lines are the ones most people act on. Weakest link names the block behind most of the downtime: here the controller, with 97%, because it sits alone in series while the pumps cover for each other. Best improvement names the single change that gains most: a 10% shorter mean repair time on the controller lifts availability to 99.444% and saves about 5 hours of downtime a year.
What to improve below ranks every lever the same way: each block's mean life, its repair time, its proof-test interval, a common-cause β, one more repair crew. In the example the pumps' levers are worth about a thirtieth of the controller's. That's the asymmetry worth knowing before you spend money: redundancy and faster repairs pay where the downtime is, and do almost nothing elsewhere, however satisfying they feel.
The figures behind the headline (mean up and down time, failure frequency, expected failures and downtime over the window, and each block's importance) are under Details. There, Run simulation (Pro) adds the spread of outcomes: the chance of no outage, percentiles and a confidence band. On the Free plan, Run quick simulation gives a shorter, time-capped estimate a few times a day. Each run on a saved diagram is kept under Run history (7 days on Free, 90 on Pro), where you can compare two runs side by side.
Where to go next
Save the diagram and it keeps its repairable setting, so you can come back and re-run it as your failure and repair estimates improve.
If you want the theory behind the numbers — the MTBF/MTTR formula, how availability composes through series and parallel structures, and the distinction between inherent and operational availability — that's covered in the Learn article on system availability.
The analysis comes from RePyability, an open-source Python library; its guide to repairable systems runs the same calculations in code.